Throughout history, brain function has been a hotly contested subject — Aristotle theorized that it regulates heart temperature, while ancient Egyptians considered it a useless organ. Luckily, modern scanning technology has allowed researchers to resolve some of these century-old debates by precisely mapping out portions of the brain.
Advances in scanning technology began with the invention of computed tomography (CT) scans, which use a rotating X-ray tube and a series of detectors to create detailed images of the body. In modern medicine, CT scans are often used in conjunction with positron emission tomography (PET) scans to create more comprehensive images. Unlike other forms of scanning, PET scans are able to detect information about metabolic changes within the body. The additional information provided allows for the further understanding of bodily functions and are widely used in the diagnosis of certain conditions. Because of its applications, PET scans are an integral part of both research and medicine.
How do PET Scans Work?
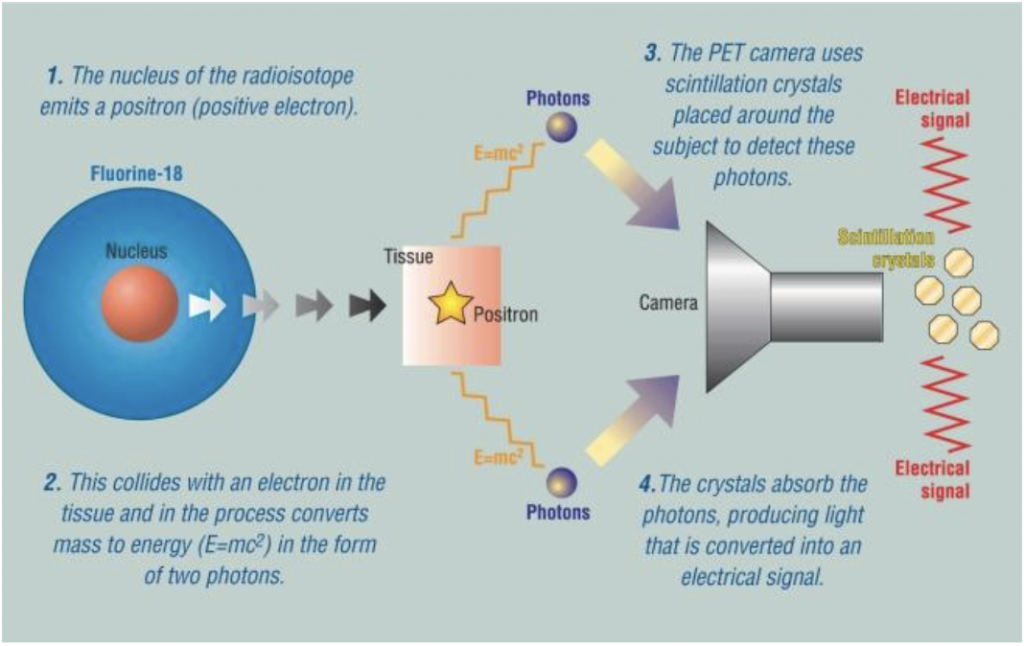
To visualize the various functions of the body, radiotracers are injected into the body. Radiotracers are molecules that are radio labeled with positron-emitting atoms that emit small amounts of radioactivity. The type of radiotracers used depends on the biological function that the PET scan is focusing on. These could reflect neurotransmitters, cancer cells, various sorts of receptors, or specific types of proteins, which makes PET a very flexible technique for studying the body. The radiotracers emit positrons, antiparticles (opposite charge, same mass) of an electron, as they decay. As the positrons are emitted, they lose some kinetic energy through collisions with the electrons within the body’s tissue, forming a positronium, which is an unstable and very short-lived hydrogen-like atom. When the positronium dissipates, two photons of 511 keV are emitted in opposing directions. The energy emitted after the dissipation is then used in a technique called coincidence detection.1
The key theory underlying coincidence detection is that if the detectors on the PET scan indicate that there are two 511 keV photons emitted along the same line of response they come from the same location.2 PET scans use crystal scintillation detectors, crystals that absorb gamma photons by converting some of the energy from the 511 keV photon into visible light and ultraviolet photons, to detect the coincidence events. These detectors are then placed with photomultiplier tubes opposite to the positron emitter, allowing signals to feed into amplifiers and classification circuits.1 The detection of the coincidence events allows for the position of where the destruction of the original positronium decay occurred to be located. The PET scanner includes hundreds of detector banks in the machine surrounding the patient, allowing for the visualization of millions of decaying positronium images. When combined, the scan can create comprehensive images of the concentration and location of the positron emitters in the patient, with areas of high concentration of radiotracers being brighter.
Applications of PET Scans
Unlike the first researchers in anatomy and brain function, modern researchers are able to visualize the functions of the brain by generating concrete evidence to substantiate theories about brain function and compartmentalization. The theory of brain function compartmentalization can be confirmed through PET scans. For example, researchers used PET scans to pinpoint areas of the brain that are active during reading comprehension. By having research subjects distinguish between fake and real words, scientists were able to deduce that certain parts of the left medial extrastriate visual cortex and the ventral occipital temporal circuits were lit up in the images produced by the scan. Thus, allowing them to determine that the majority of reading comprehension was centered in this area.
Using PET scans to determine areas of the brain that are involved in various neurological processes also enhances medical practitioners’ abilities to accurately diagnose conditions and aid in early detection. The flexibility of PET scans means that radiotracers can be designed to target specific molecules to track their course through the body.

PET scans have been used in the diagnosis of Parkinson’s as they can accurately determine the reason for the loss of motor function. By finding the cause behind the patient’s symptoms, doctors are able to more accurately diagnose patients as some symptoms are shared between many different neurological conditions. By symptoms alone, it can be easily confused with other conditions like progressive supranuclear palsy.4 More commonly, PET scans are used to track the neurotransmitters in Parkinson’s disease so that a visualization of the brain’s dopamine system can be made. Another key aspect to PET scans is that it does not damage the blood brain barrier, an important defense mechanism for the brain. This means that PET scans offer an unique noninvasive approach to the diagnosis of different types of neurological conditions in contrast to other methods.5
Aside from these unique advantages, PET scans can also be used throughout the body, including in presymptomatic cancer detection. One of the main indicating tracers in PET cancer detection is fluorine-18 deoxyglucose, which has a similar chemical structure to glucose. As a result, this radiotracer can be taken up by cells instead of glucose. Cancerous cells, which have elevated glucose metabolism, will glow more brightly than healthy cells, and are more easily detected and diagnosed. PET scans can be used all throughout the body but the prevalence in PET scan usage in neuro-oncology can also be attributed to the noninvasive nature of PET scans. It is often used preemptively as the metastasis of tumors to the brain are very likely with an incredibly high mortality rate. For patients with brain cancer, PET scans are more suitable for diagnosis as the imaging extends beyond the capabilities of the MRI, allowing for better detection.5
The versatility of PET scanning has made it a staple visualization technique in research and medicine. However, many aspects of PET scans remain in development, including optimizing the sensitivity of the detectors and combining it with other scans, such as the MRI and CT scans. When used in conjunction with CT scans, doctors are able to provide an overlay of the radioactivity from the PET scan over the 3D image created by the CT scan. Developers are especially interested in using PET scans’ diagnostic capabilities in precision medicine, medicine that is tailored to a specific person. It is the hope that these additions to PET scans will allow researchers to build on the knowledge of neuroanatomy to serve people more effectively. From the earliest frontrunners of neuroanatomy to the modern day, PET scans have made theories into realities. With novel imaging techniques on the horizon, researchers will applaud the progress they have made since curiosity led them to question their realities.
Acknowledgments
I would like to express my deepest gratitude to Dr. Jagust of the University of California, Berkeley for reviewing my article and providing detailed feedback.
References
- Shukla, A. K., & Kumar, U. (2006). Positron emission tomography: An overview. Journal of medical physics, 31(1), 13–21. https://doi.org/10.4103/0971-6203.25665
- Introduction to PET Physics: The physical principles of PET. (n.d.). Retrieved November 11, 2023, from https://depts.washington.edu/imreslab/from%20old%20SITE/pet_intro/intro_src/section2.html
- Price, Cathy J., and Joseph T. Devlin. “The Interactive Account of Ventral Occipitotemporal Contributions to Reading.” Trends in Cognitive Sciences 15, no. 6 (June 1, 2011): 246–53. https://doi.org/10.1016/j.tics.2011.04.001.
- Tai YF, Piccini PApplications of positron emission tomography (PET) in neurologyJournal of Neurology, Neurosurgery & Psychiatry 2004;75:669-676.
- Verger, A., Kas, A., Darcourt, J., & Guedj, E. (2022). PET Imaging in Neuro-Oncology: An Update and Overview of a Rapidly Growing Area. Cancers, 14(5), 1103. https://doi.org/10.3390/cancers14051103
Image References
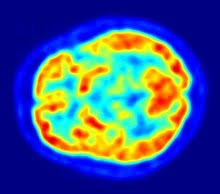
Banner Image: Maus J. (2010) Own Work
Figure 1: Berger A. (2003). How does it work? Positron emission tomography. BMJ (Clinical research ed.), 326(7404), 1449. https://doi.org/10.1136/bmj.326.7404.1449
Figure 2: PETMRI-scanner-Biograph-mMRI-3T-Siemens-Erlangen-Germany.jpg (600×564). (n.d.). Retrieved November 11, 2023, from https://upload.wikimedia.org/wikipedia/commons/a/ae/PETMRI-scanner-Biograph-mMRI-3T-Siemens-Erlangen-Germany.jpg